Want to Make Charts Like This?
Want to make charts like the one above?
Then get over to Burning Books (420 Connecticut Street) on Wednesday, February 8 at 6pm, where the newly formed Buffalo Research Collective will offer a workshop called “Follow the Money, Map the Power.” From the Buffalo Research Collective’s press release:
On January 5th, Donald Trump’s campaign manager was the featured speaker at a $5,000 per plate luncheon. The fundraiser was held at The Westin, located in the heavily subsidized Delaware North building in downtown Buffalo.
The event sparked plenty of protest action but left us with some important questions: Who owns the building? Who hosted the fundraiser? What are their ties to local decision-makers and prominent institutions? How do they make their money? How do they spend it? What do they stand to gain from the Trump administration? There’s a lot we don’t know about how power operates in Buffalo, but answering questions like these can help us to look beyond the luncheon and hold the system accountable.
This is where the Buffalo Research Collective (BRC), a new independent research group focused on transparency and accountability, comes in. And you can be a part of it!
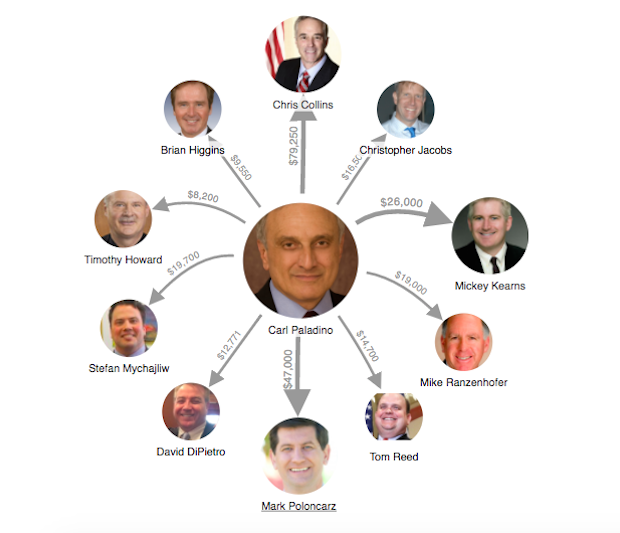
At Wednesday’s training, the BRC will give a lesson on using Oligrapher, the data visualization tool developed by the Buffalo-based research organization LittleSis—the very tool used to make the basic chart above, documenting developer Carl Paladino’s donations to local public office-holders. By the end of the night, you’ll know how to make your own. And soon enough, you’ll be creating things like this: